
We could only manually review a fraction of campaigns each week. Now every single one gets analysed every night.
Over two hundred active campaigns. One team. A proper review took about an hour each; fewer than five percent got one in any given week.
The reviews that happened were symptom-driven — something had to go visibly wrong before it got attention. Everything else got a quick skim or nothing. Advertisers got inconsistent advice. Patterns that existed across campaigns were invisible because nobody was looking across campaigns.
The fix wasn’t more headcount. It was a pipeline that runs every night whether anyone asks it to or not.
What I built
Three layers, fully automated, no manual steps.
The pipeline starts by fetching live campaign data from the data warehouse each night — performance, config, audit log — then computes the metrics that matter: CTR by search term, budget pacing, ad group performance, platform splits. From there, the evaluation layer runs deterministically: the numbers are computed first, then flagged for budget waste in low-relevance search terms, pacing inefficiencies, underperforming ad groups, platform imbalances. Finally, Amazon Bedrock (Claude) takes the structured findings and turns them into narrative recommendations — grounded in the numbers, in the right language for our market.
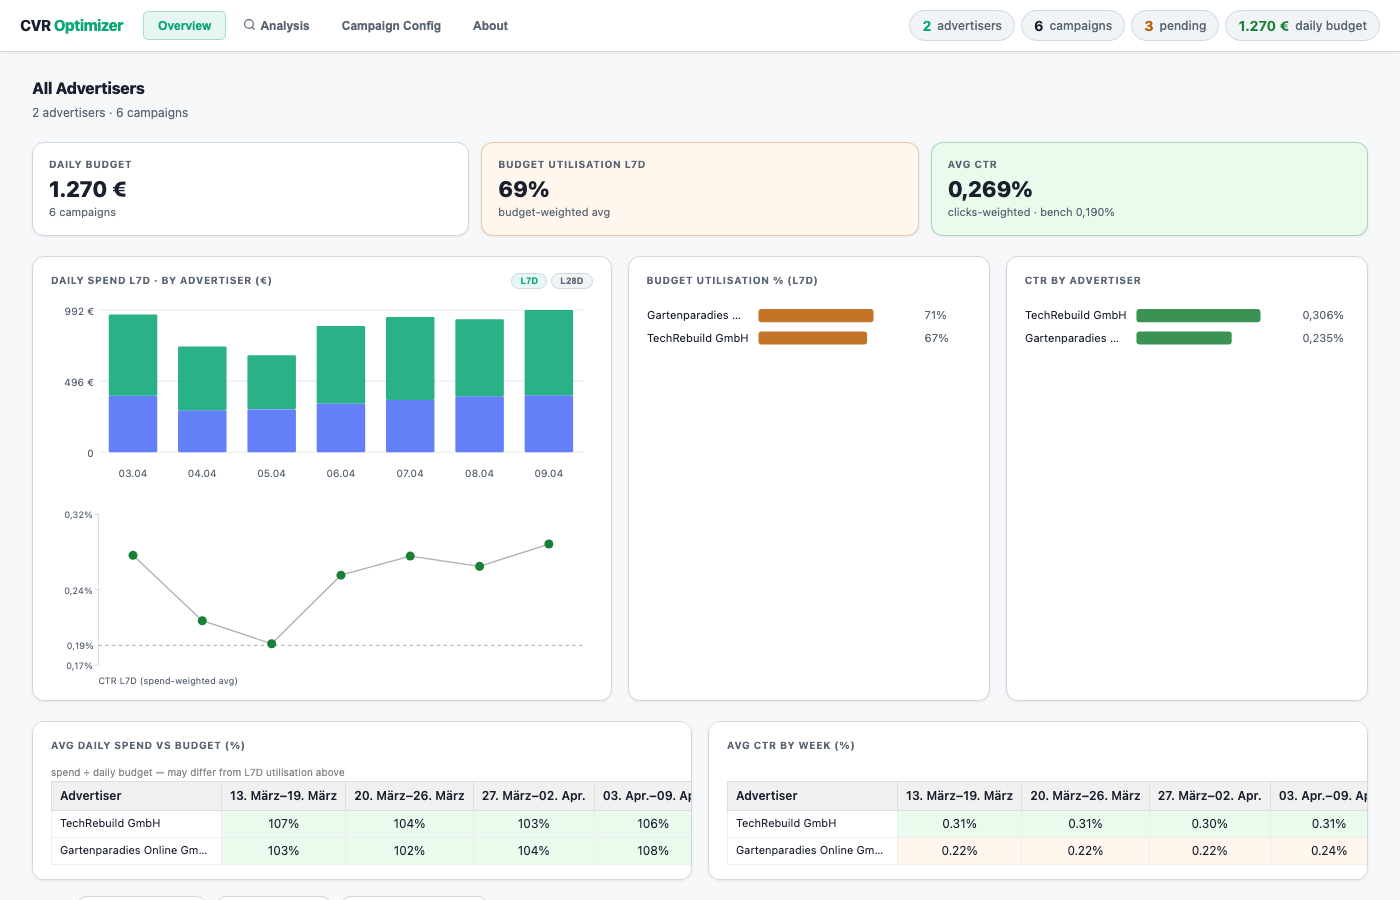
The output is an interactive dashboard: one view per campaign, with trend charts, hourly pacing curves, config change history, and a full written analysis. Every campaign. Every night.
What it looks like in practice
One campaign was burning impressions on a broad-match keyword that shared vocabulary with the product but none of the intent — a generic category term pulling volume and near-zero clicks. A human would only have caught it by pulling the search term report and sorting by impression share. Nobody had.
The pipeline surfaces it automatically, flags it as waste, and generates a specific recommendation: add the term as a negative keyword, or switch to a positive keyword list if the platform supports it.
That’s the intelligence layer: not just “here’s the data” but detection (what’s wrong), diagnosis (why), and prescription (what to do). The human reads the recommendation and acts. The human doesn’t need to go looking for the problem first.
What changed
Coverage went from partial, symptom-driven reviews to every campaign, every night. The quality improved too — recommendations can go deeper because the analytical groundwork is already done, and advertiser conversations start from insights rather than from data gathering. But the less obvious change was visibility: patterns that only emerge across campaigns became apparent. Consistent waste on the same class of search terms showing up across multiple advertisers at once. That’s only visible when you’re looking at everything.
The quality floor went up because nothing gets skipped. Not because the ceiling got higher — because consistency replaced selection bias as the operating model.
Where it breaks
Output quality depends on data quality upstream. Edge-case campaigns with unusual structures sometimes produce recommendations that need a closer human look before acting on. And as with any LLM synthesis layer, the narrative is only as good as the structured signal fed into it — the pipeline is designed so the numbers are computed deterministically first, and Claude handles interpretation, not calculation.
Here’s the pipeline end to end:
graph LR
    A["Data warehouse\nperformance + config + audit log"] --> B["Feature extraction\nCTR · pacing · search terms · ad groups"]
    B --> C["Evaluation layer\nwaste detection · pacing flags · platform split"]
    C --> D["LLM synthesis\nAmazon Bedrock — diagnosis + recommendations"]
    D --> E["Dashboard\ntrend charts · pacing · config history"]
    E --> F["GitHub Pages\nshared with the team"]
Fully headless — no browser, no manual steps. A scheduled job triggers it nightly. A 15-test end-to-end suite gates every deploy.
| Layer | Tools |
|---|---|
| Data | data warehouse SQL · Python · pandas |
| Analysis | metric computation scripts · deterministic aggregation |
| Intelligence | Amazon Bedrock (Claude) |
| Delivery | vanilla HTML/JS · GitHub Pages |
| Reliability | Playwright E2E tests · automated QA gate |
See it live
Related: CTR is not the story. It’s the first sentence. — the proxy problem that made building conversion signal infrastructure worth it.